
The Reality of Incomes, Taxes, and Redistribution in America
Here are three findings that challenge common claims regarding taxes, middle class incomes, and wealth redistribution in the United States.
As my Cato colleague Chris Edwards mentioned last week, the Congressional Budget Office on Friday released its annual report on trends in U.S. household income, means‐tested transfers, and federal taxes between 1979 and 2017 (the most recent year for which tax data were available). The CBO report is, as usual, chock‐full of interesting information, but today I’d like to focus on three findings that challenge common claims regarding taxes, middle class incomes, and wealth redistribution in the United States.
First, and echoing Chris’ post from last week, the CBO shows that total annual federal taxes — income, payroll, corporate, and excise — paid by the richest Americans (households making around $300,000/year or more) have basically doubled since 1979. Over the same period, the middle classes have paid almost the same amount of federal taxes, and the poorest Americans’ federal tax burden has all but disappeared.

Second, the average value of means‐tested transfers (cash payments and in‐kind benefits from federal, state, and local governments) has increased for all income groups since 1979, but has grown dramatically for lower‐income Americans:

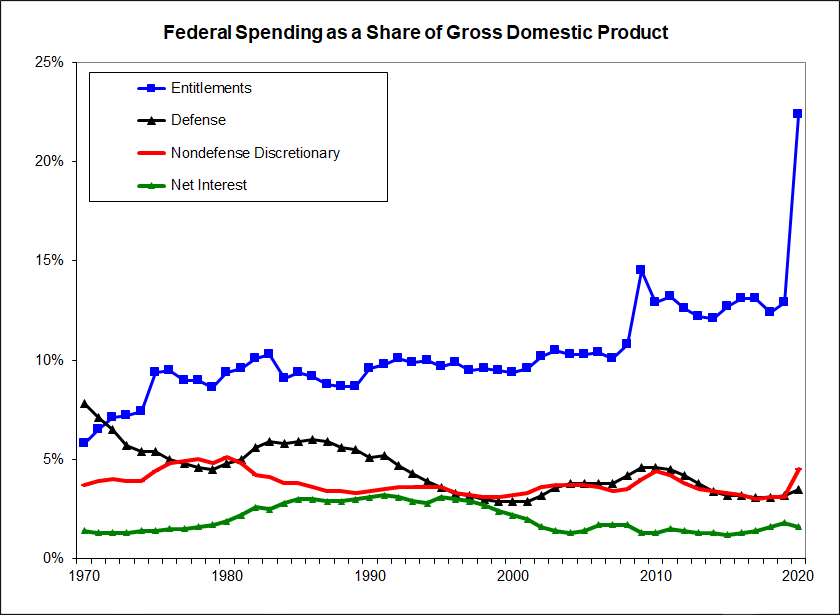
According to the CBO, the significant growth in means‐tested transfers between 1979 and 2017 has primarily been driven by (1) expanding eligibility for middle‐income groups; and (2) spending on Medicaid (“the largest—and fastest growing—means-tested transfer program”) due to an almost‐fivefold increase in enrollees (from about 20 million in 1979 to 94 million in 2017) and an increase in average per capita benefits from $1,700 to $5,500 (in 2017 dollars). This trend, of course, is consistent with other data showing the extent to which entitlements have increasingly consumed federal spending in recent years.
Third, the CBO report shows that both median household incomes and average group incomes have enjoyed real (inflation‐adjusted) gains since the early 1980s, with the aforementioned progressivity of the United States’ tax/transfer systems playing a big role.
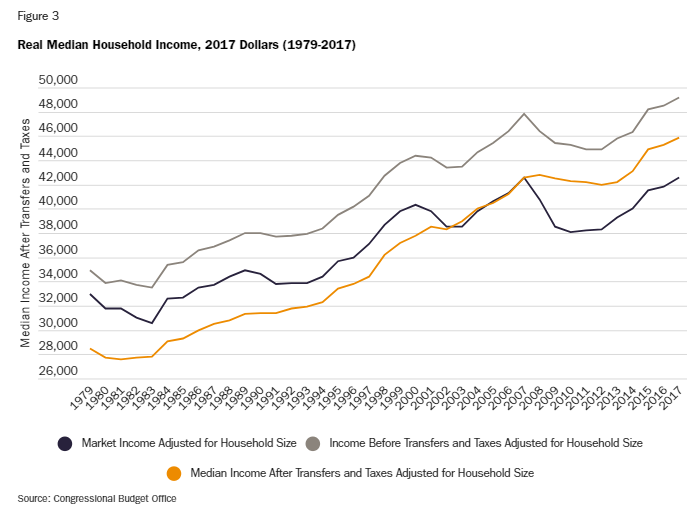
As shown in Figure 3 above, real median household incomes after taxes and transfers saw a 61.1 percent increase between 1979 and 2017. Importantly, the taxes and transfers analyzed by the CBO once subtracted from middle class market incomes but began to supplement them in the mid‐2000s — a trend my colleague Ryan Bourne noted here a few years ago. By 2017, these taxes and transfers added $3300 (7.7 percent) to median market incomes.
Similar trends apply to average incomes:

As Figure 4 shows (click on various groups to highlight or exclude them), the poorest American households’ average incomes bottom out in 1983 and then grow by approximately 95 percent through 2017, aided substantially and increasingly by taxes and transfers. By 2017, in fact, well over half of these households’ annual income comes from the government. Furthermore, an increasing number of American households (on average) became net recipients of government benefits: the bottom two quintiles paid less in federal taxes than they received in transfers every year since 1979 (with total net benefits increasing substantially through 2017), but they were joined in 2002 by third quintile households (with real market incomes starting around $60,000 per year). By 2017, taxes and transfers added $6,300 to this group’s average market income of $61,700 — a 10.2% gain. The net tax/transfer burden in 2017 was also much lower — though still net negative — for the fourth quintile of households than it was in 1979, while the top income group saw only modest relief (paying a slightly smaller share, but larger amount, of income to the government on net) over the same period.
As Bourne noted back in 2017, the CBO data are imperfect — for example, excluding state and local taxes and showing only averages (which can hide costs and benefits that certain taxpayers face). Nevertheless, the CBO’s new report adds to the growing body of empirical literature refuting common myths about middle class incomes and the progressivity of the U.S. system. One can (and in my opinion should) question whether that system is delivering the optimal mix of total wage and non‐wage compensation to American workers, or the whether the significant and increasing redistribution that we employ has proven effective. But those questions don’t change the underlying facts presented by the CBO — facts that are light‐years away from much of the populist and anti‐capitalist hysteria we hear right now.
This article first appeared at the Cato Institute.
Image: Reuters.